Project Documentation
Explore the core features, tools, and technical logic of the Solivia Lab Intelligence OS.
Main Pages & Navigation
The entry point to your intelligence ecosystem. Manage multiple workspaces and deep-dive into specific projects.
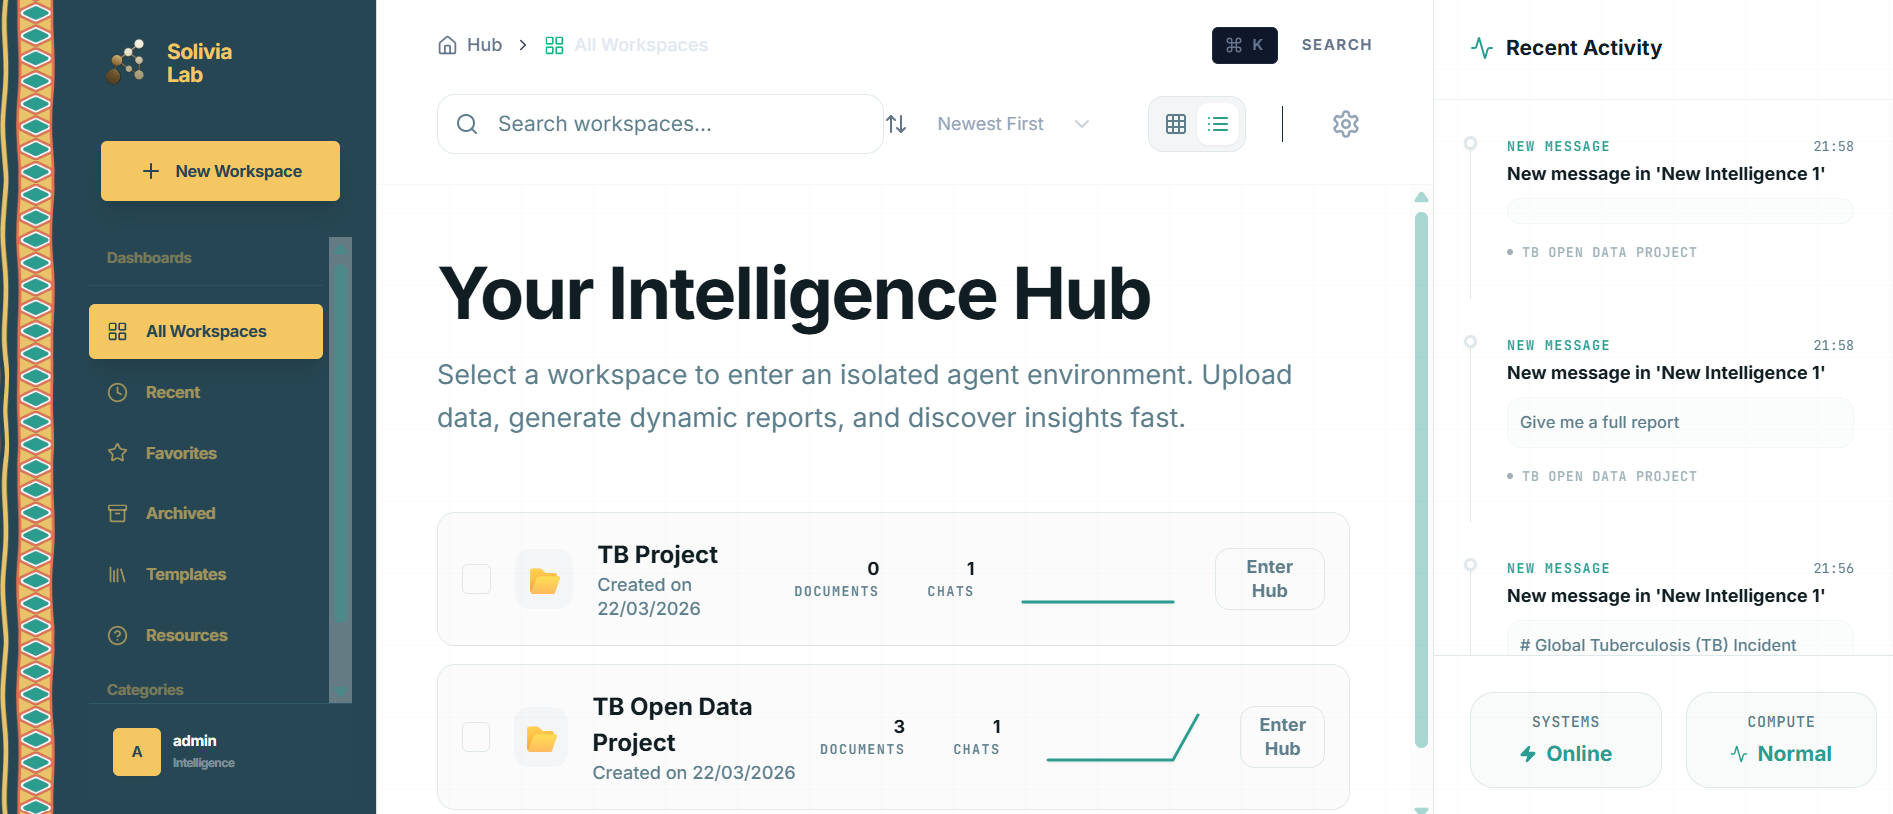
Workspaces Index
The landing dashboard after login. Filter through projects, view status, and create new intelligence environments from a single view.
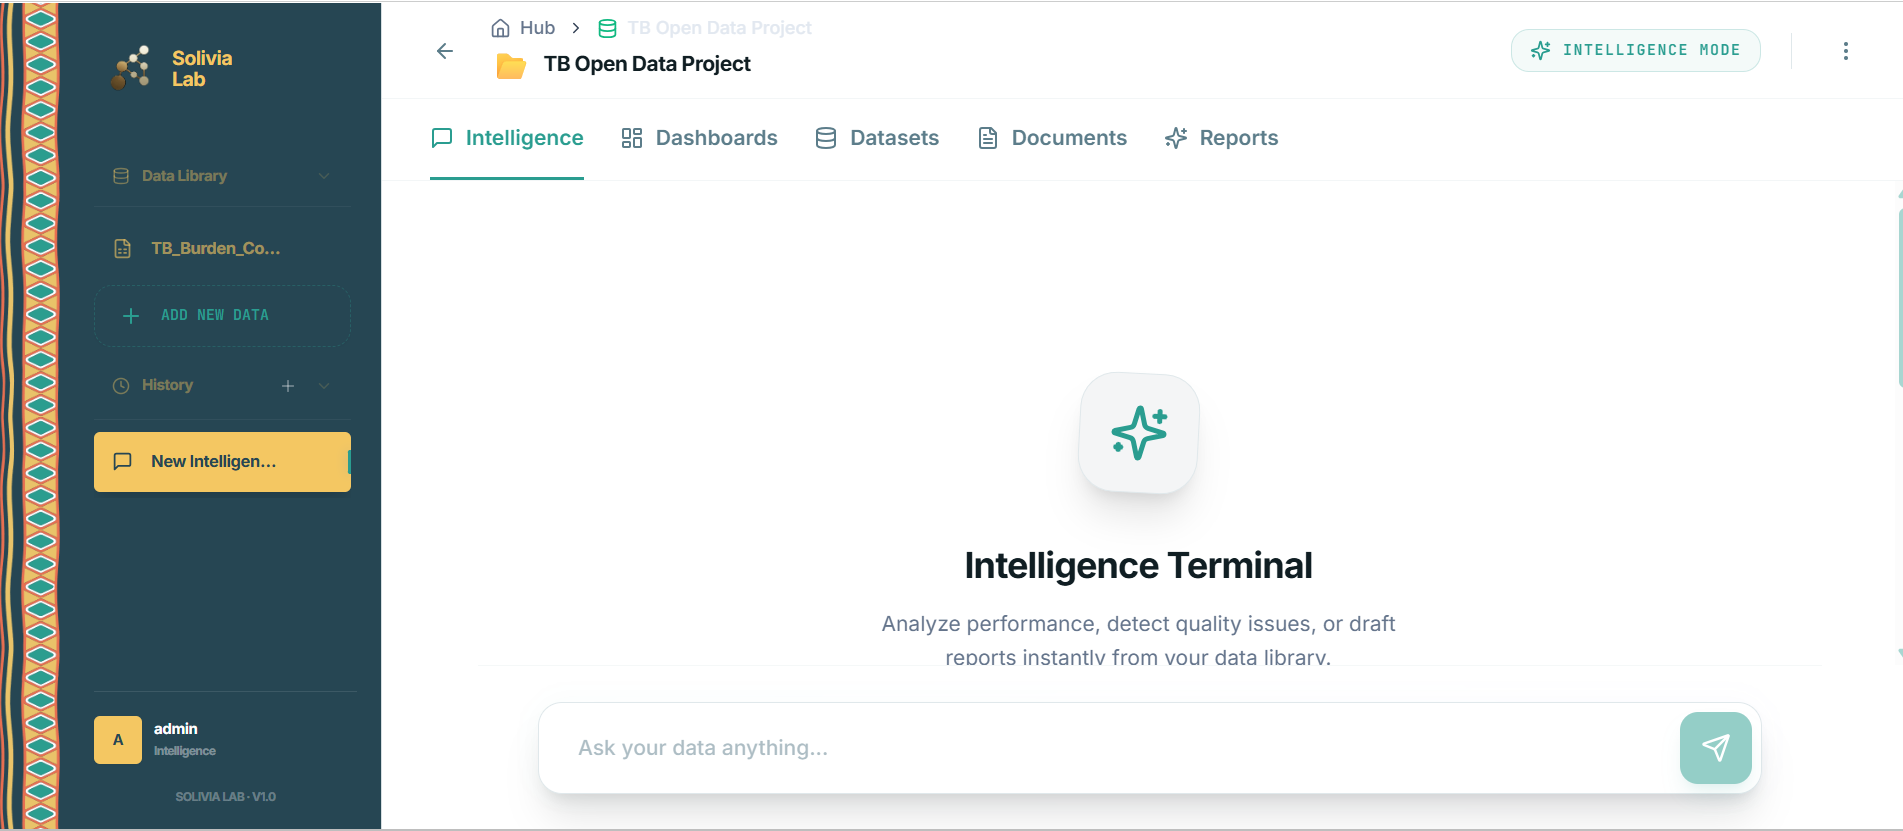
Workspace Canvas
The unified hub for a specific project. Includes the persistent Sidebar for history, Header for breadcrumbs, and Tab Navigation for different analytical modes.
Intelligence & Synthesis
Natural language interface for complex data analysis. Ask questions and receive high-fidelity visualizations.
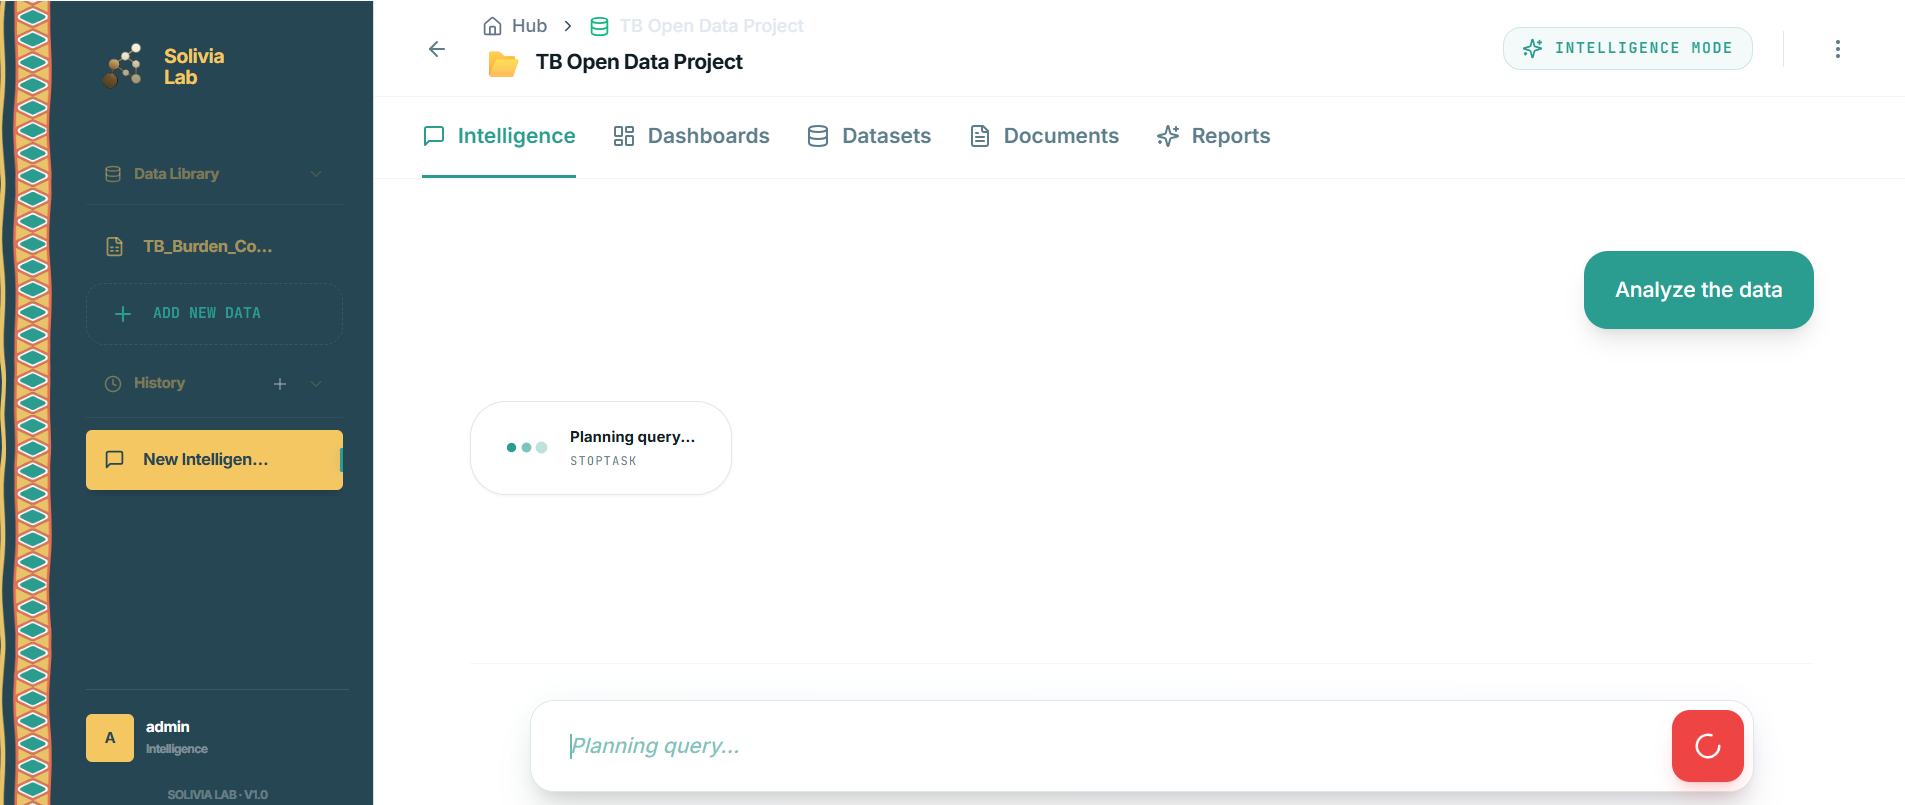
1. Planning a Query
Before executing data operations, the system proposes an analysis plan. This ensures transparency in logic (e.g., Filtering > Pivoting > Visualizing).
2. Analysis Output
The result is a composition of narrative text, interactive charts, and tables. Every point in the charts is linked back to the original dataset rows.
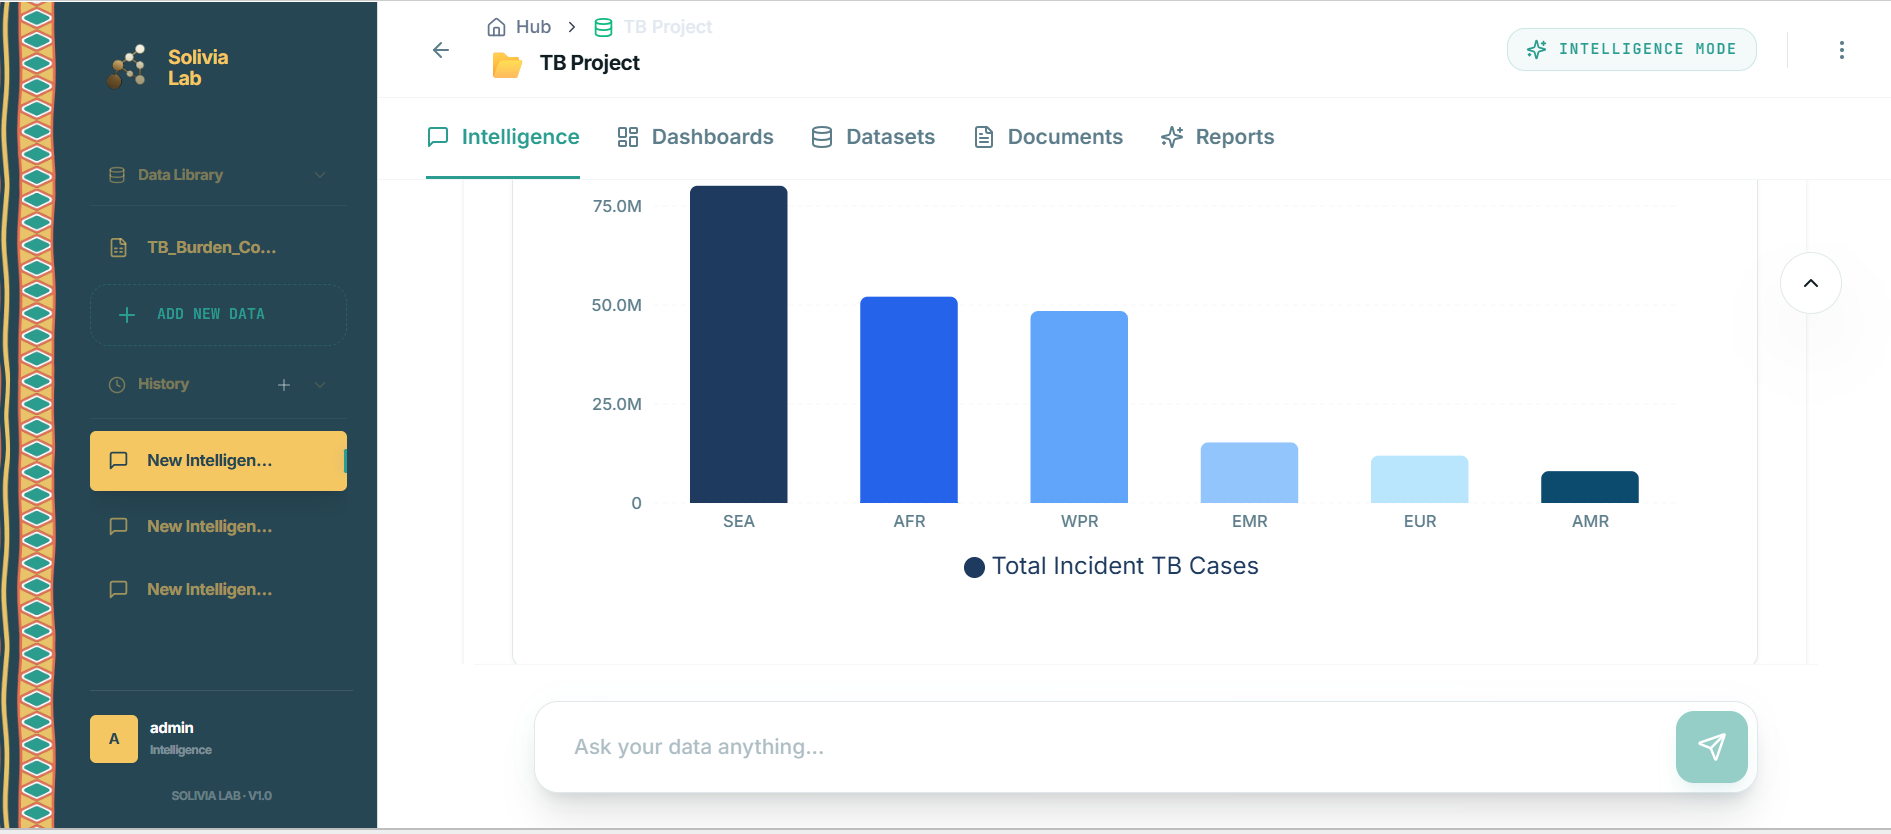
Save Report
Instantly collect charts and narratives into your workspace report pad for final documentation.
Cross-Dataset Logic
The engine intelligently pairs dimensions from multiple files to find correlations and hidden insights.
Audit Trail
Every insight is backed by the DuckDB OLAP engine, ensuring 100% accuracy and traceability.
Data Management & Quality
Centralized asset library with built-in Data Quality Audit (DQA) and advanced row-level exploration.
Dataset Library
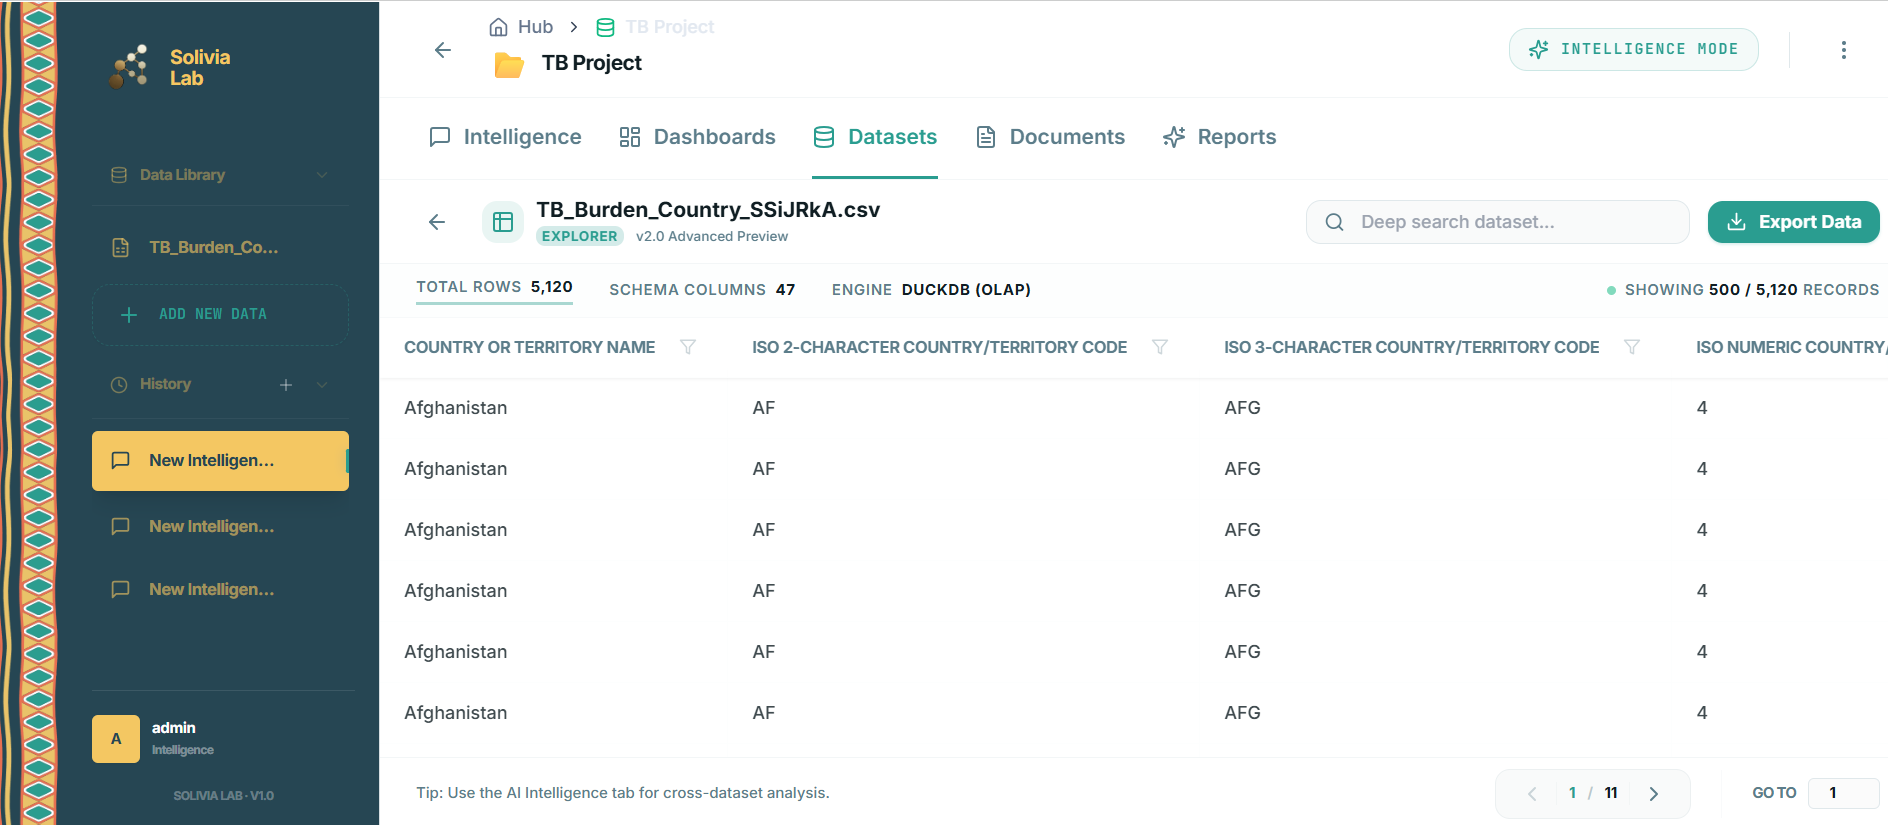
A unified view of all CSV, Excel, and PDF data assets within the workspace.
DQA Audit System
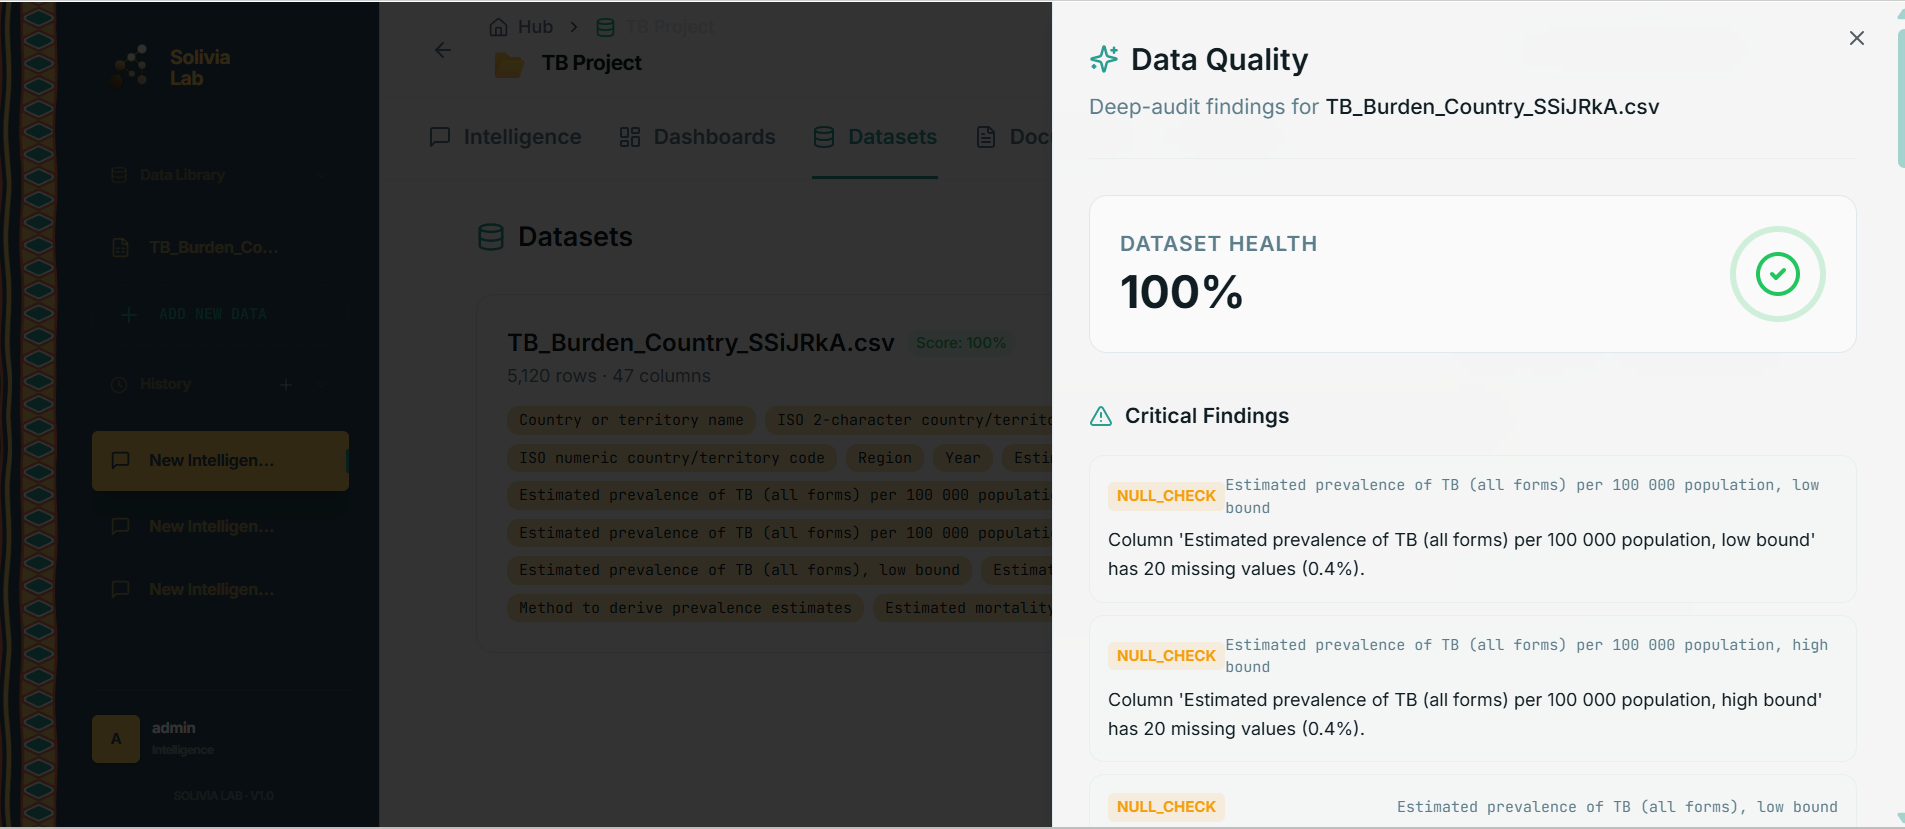
Automated health scores detect anomalies, missing values, and schema drifts instantly.
Saved Intelligence & Reporting
Compile your finding into professional documents ready for stakeholders.
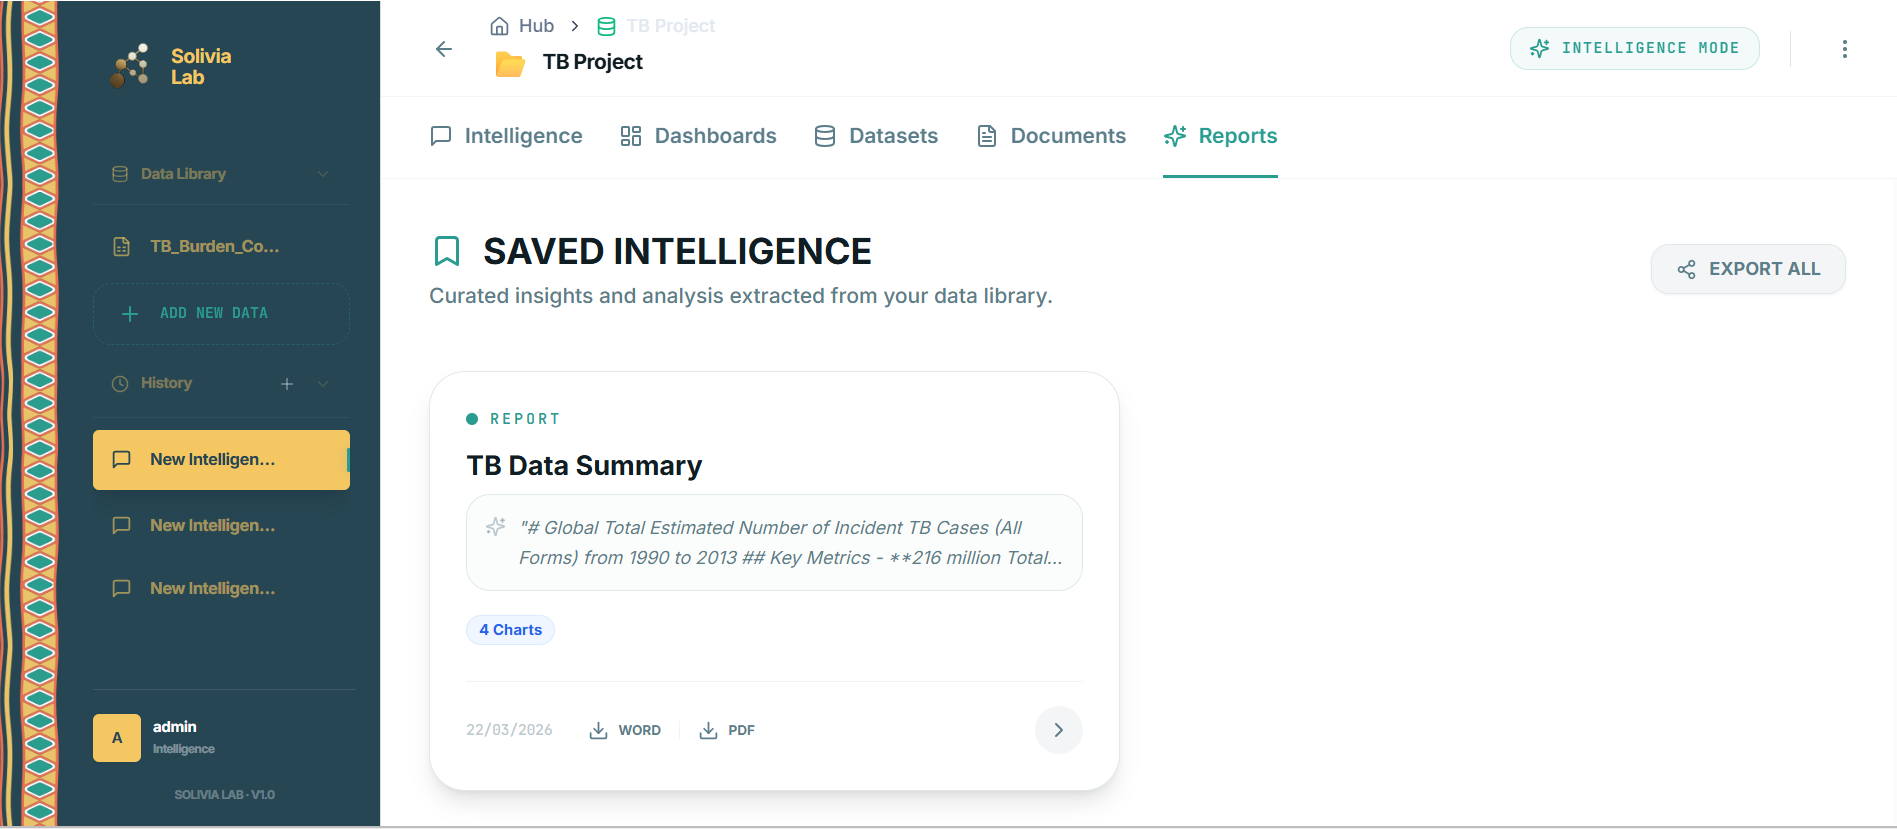
Report Canvas
VERSION 2.1 STABLE
Multi-Format Export
Save your curated analysis into permanent records. Export any report to professional PDF or Microsoft Word formats with a single click.
Interactive Replay
Click any saved report to reopen it in the full-page canvas. Edit narratives, refine charts, and update data sources dynamically.